In Burlington, luxury home sales rose compared with last year, but contrasting GTA trends could affect the calculations for homeowners planning to upsize.
Three Luxury Markets
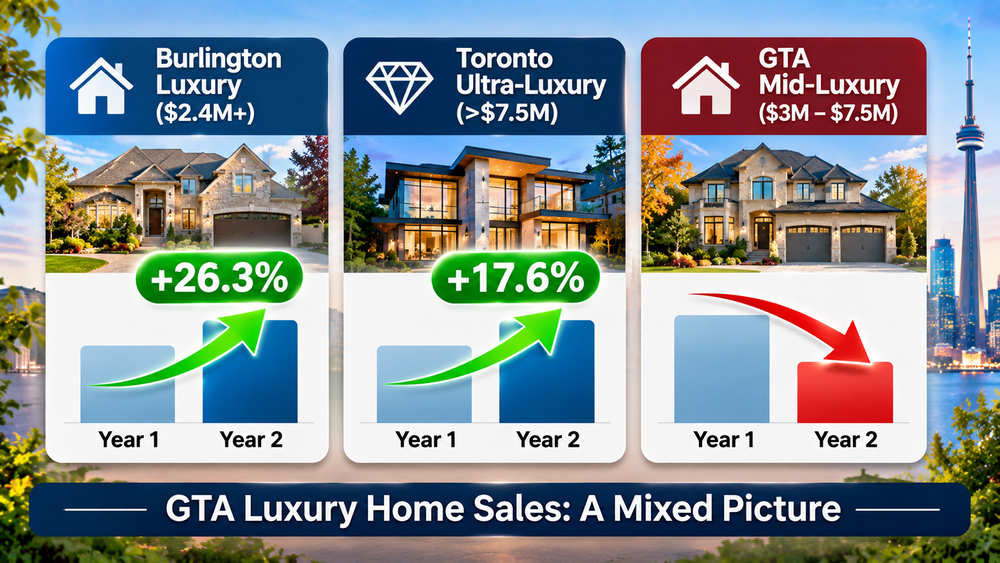
RE/MAX Canada’s November 9 report compares January–September 2026 with the same nine months of 2025. These are changes in sales volume, not prices. Burlington is part of the wider GTA, so the data does overlap.
| Market | Luxury price threshold | Sales change, Jan–Sep 2026 vs. 2025 |
|---|---|---|
| Burlington | $2.4 million+ | Up 26.3% (72 vs. 57) |
| GTA ultra-luxury | Above $7.5 million | Up 17.6% |
| GTA overall luxury | $3 million+ | Down 9.4% (841 vs. 928) |
The categories overlap, and the percentages describe sales volume, not property-price changes. Source: RE/MAX Canada’s November 9 luxury report.
Burlington Growth
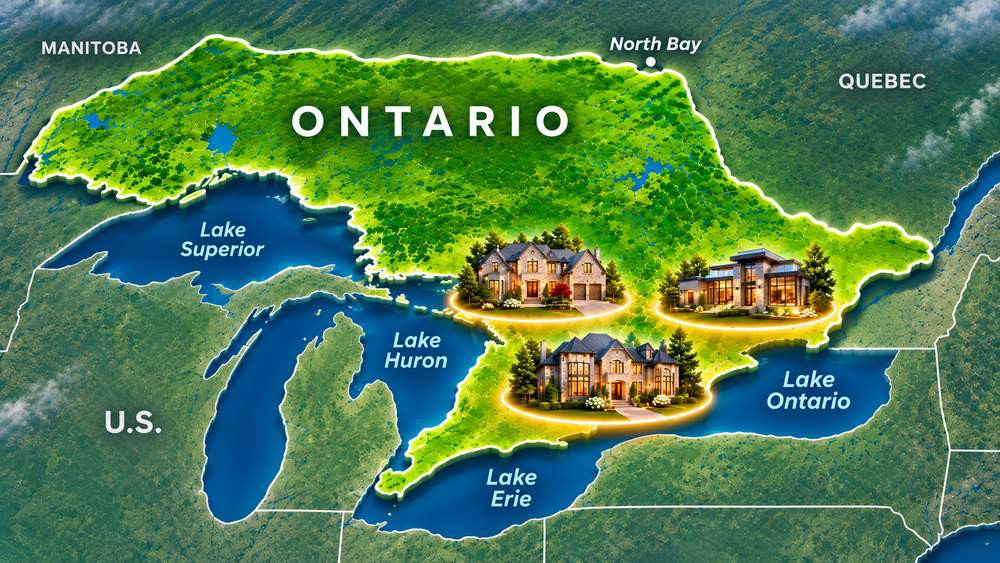
Burlington’s increase is based on a small volume of 15 more sales (than a year ago) so the small base makes the percentage look dramatic. RE/MAX’s Burlington market commentary points to Toronto and Oakville buyers seeking privacy, space and waterfront lifestyle.
Toronto Ultra Luxury Growth
Meanwhile, GTA sales above $7.5 million grew 17.6%, and 15 Toronto properties exceeded $10 million, according to RE/MAX. The $7.5-million-plus tier is included in the GTA’s broader $3-million-plus total. That distinction matters when interpreting the overall decline.
It could be inferred that because the top priced property sales grew but the combined group shrank, the $3-million-to-under-$7.5-million segment must have declined by more than 9.4%.
Broader Luxury GTA Decline
Across the broader GTA, sales of $3-million-plus homes dropped from 928 to 841, a decline of 87 transactions. Oakville separately declined 16.7% above its $3.25-million threshold. Fewer sales do not establish how much comparable property prices changed.
RE/MAX and Royal LePage describe buyer caution amid economic uncertainty. A national Ipsos survey also found prospective purchasers waiting for lower prices, but that survey did not specifically sample GTA luxury buyers. These are plausible factors, not proven causes of the GTA decline.
Statistics Canada reports that financial assets are concentrated among the wealthiest Canadian households. Inference: investment gains could give some ultra-luxury purchasers greater flexibility. That does not establish that investment profits caused these purchases.
Upsizing Your Home
RE/MAX suggests narrower price gaps can create trade-up opportunities. You may sell your current house for less than expected but negotiate a larger reduction on a more expensive replacement. Compare the net cost of moving, rather than just the new home’s asking price.
Use realistic sale proceeds, then include commissions, Ontario land transfer taxes, legal fees, moving costs and possible mortgage penalties. The better deal is the one that works for your actual finances. An attractive listing discount does not guarantee financing.
Mortgage Qualification
For example, assume you purchase a $2.4-million home with 20% down and no extra financed costs. That requires a $480,000 down payment and a $1.92-million mortgage. Home equity alone does not establish lender approval.
Most newly underwritten uninsured mortgages at federally regulated lenders must qualify at the greater of 5.25% or the contract rate plus two percentage points. See OSFI’s current qualifying requirements. Income, debts, carrying costs and a temporary overlap between homes may affect approval.
Household affordability and mortgage qualification are different tests. Allow for property taxes, insurance, maintenance, utilities and a financial cushion. Our mortgage stress test guide explains the lender side.
What Buyers Should Do
Burlington’s rise and the GTA’s split are sales activity indicators, not forecasts of house prices. Before trading up, establish your net sale proceeds and a realistic purchase budget, then confirm mortgage qualification before committing. Your individual numbers matter more than the headline.